Growing Degree Days (GDD), Explained
Learn what growing degree days are, how GDD calculation works, how GDD predicts crop stages, and how Terra Oracle AI uses thermal time for better agronomic decisions.
Crop growth does not follow the calendar perfectly.
A maize crop planted on the same date in two different years may reach the same growth stage on different dates. A wheat field may develop faster during a warm spring and slower during a cool one. Pest pressure, disease risk, flowering, harvest timing, and fertilizer timing can all shift because crop development is strongly influenced by temperature.
This is why agronomists use growing degree days, often shortened to GDD.
Growing degree days are a way to measure accumulated heat over time. Instead of asking only “how many days have passed since planting?”, GDD asks a more agronomic question:
How much useful heat has the crop accumulated since the start of development?
This makes GDD one of the most practical agronomic indices for crop-stage prediction, field scouting, irrigation planning, nutrient timing, pest management, and harvest preparation.
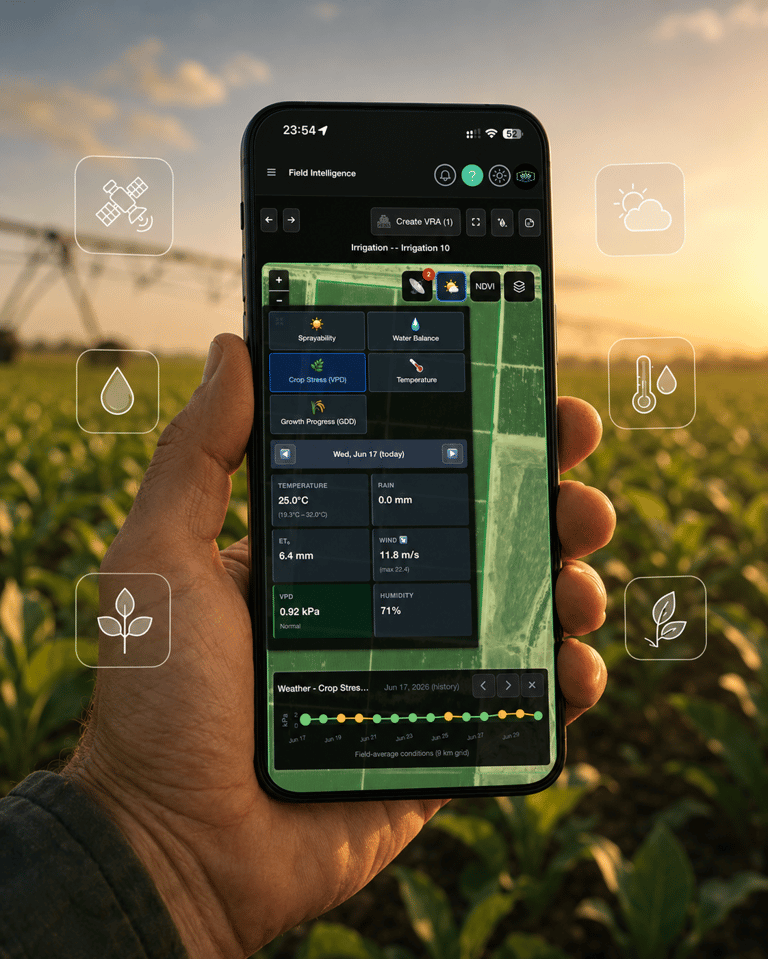
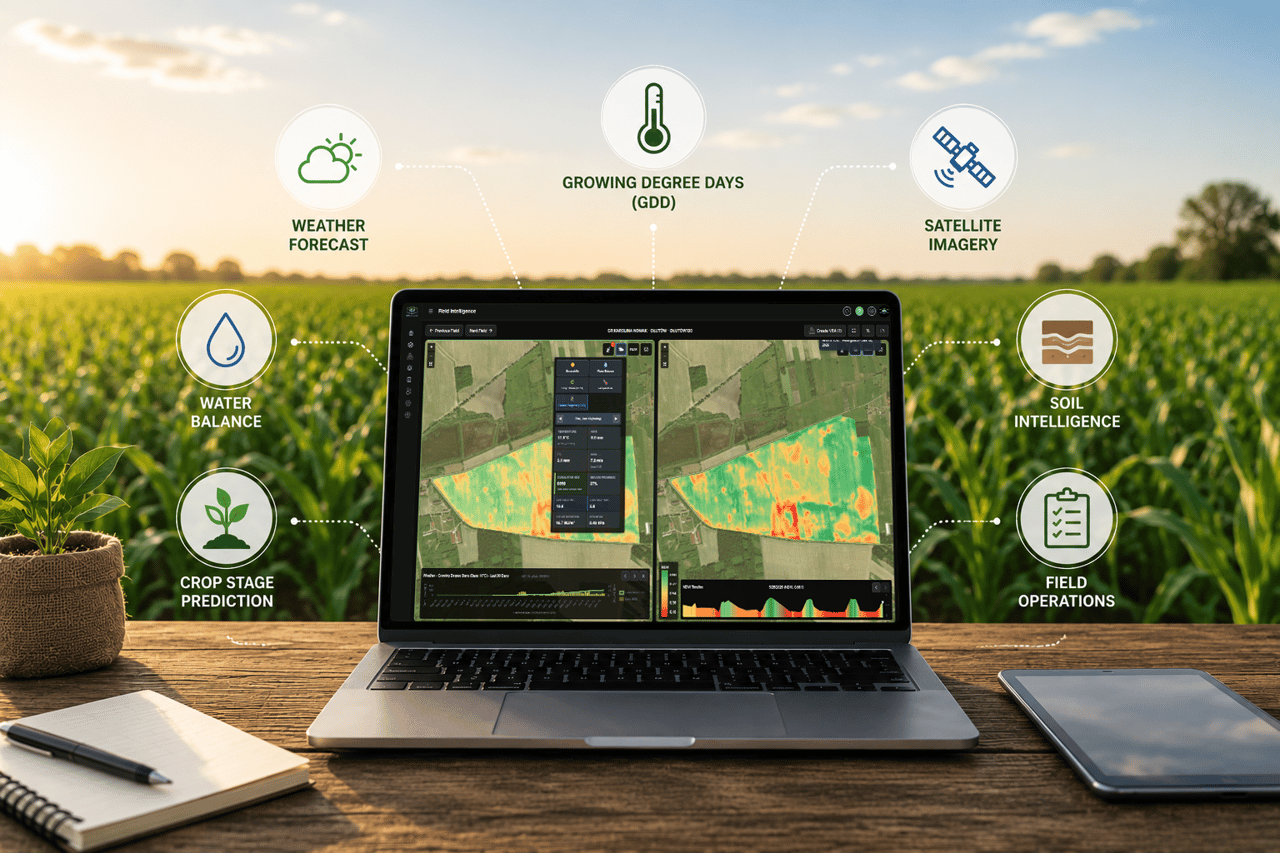
For Terra Oracle AI, GDD is not just a weather number. It is part of a wider field-intelligence system that connects weather, crop development, satellite imagery, soil variability, water balance, and field operations into explainable agronomic decisions.
What Are Growing Degree Days?
Growing degree days measure the accumulation of heat available for crop development.
Plants generally develop faster when temperatures rise above a crop-specific base temperature. Below that base temperature, development is slow or may effectively stop. As daily temperatures increase above the base, the crop accumulates thermal time.
In simple terms:
Growing degree days = useful heat accumulated by the crop over time
GDD is also called:
- Crop heat units
- Degree days
- Thermal time
- Heat accumulation
The concept is used because many biological processes in crops, insects, and diseases are more closely related to accumulated temperature than to calendar days alone.
Why GDD Matters in Agriculture
GDD helps growers and agronomists estimate where the crop is in its development cycle.
This is important because many field operations are growth-stage dependent. The correct timing for nitrogen, fungicide, irrigation, plant growth regulators, pest scouting, and harvest preparation often depends on the crop stage, not simply the calendar date.
Growing degree days can help answer practical questions such as:
- Is the crop developing faster or slower than normal?
- When is the next key growth stage expected?
- Is the crop approaching flowering, grain fill, maturity, or harvest?
- When should scouting be prioritized?
- Is a pest or disease risk window approaching?
- Should a nutrient or crop protection application be advanced or delayed?
- Is the field behind because of cold weather, water stress, soil constraints, or poor establishment?
This is why GDD is a core part of crop monitoring and decision support.
GDD Calculation: The Basic Formula
The most common simple GDD calculation is:
$$ \mathrm{GDD} = \frac{T_{\max} + T_{\min}}{2} - T_{\mathrm{base}} $$
where $T_{\max}$ and $T_{\min}$ are the daily maximum and minimum temperatures, and $T_{\mathrm{base}}$ is the crop-specific base temperature.
If the result is negative, the daily GDD is usually recorded as zero.
For example:
- Daily maximum temperature: 28°C
- Daily minimum temperature: 14°C
- Average daily temperature: 21°C
- Base temperature: 10°C
$$ \mathrm{Daily\ GDD} = 21 - 10 = 11 $$
If the next day accumulates 9 GDD, the running total becomes:
$$ 11 + 9 = 20\ \text{(accumulated GDD)} $$
Over the season, daily GDD values are added together to estimate crop development progress.
What Is Base Temperature?
The base temperature is the lower threshold below which crop development is assumed to be minimal or stopped.
Different crops use different base temperatures. For example, warm-season crops such as maize usually require a higher base temperature than cool-season crops such as wheat or barley.
The base temperature should be selected according to:
- Crop species
- Variety or hybrid
- Local agronomic practice
- Growth stage
- Scientific or extension recommendations
- Regional calibration
This is one of the most important points in GDD calculation. A GDD number is only meaningful if the correct base temperature and calculation method are used.
What About Upper Temperature Limits?
Some GDD methods also use an upper temperature limit.
This is because crop development does not increase forever as temperature rises. Above a certain point, very high temperatures may stop accelerating development and may even cause stress, sterility, reduced pollination, water stress, or yield loss.
In those systems, the daily maximum temperature may be capped at an upper threshold before calculating GDD.
This is especially important in hot environments, irrigated systems, and crops that are sensitive to heat during flowering or fruit development.
GDD Crop Stages: How Thermal Time Predicts Development
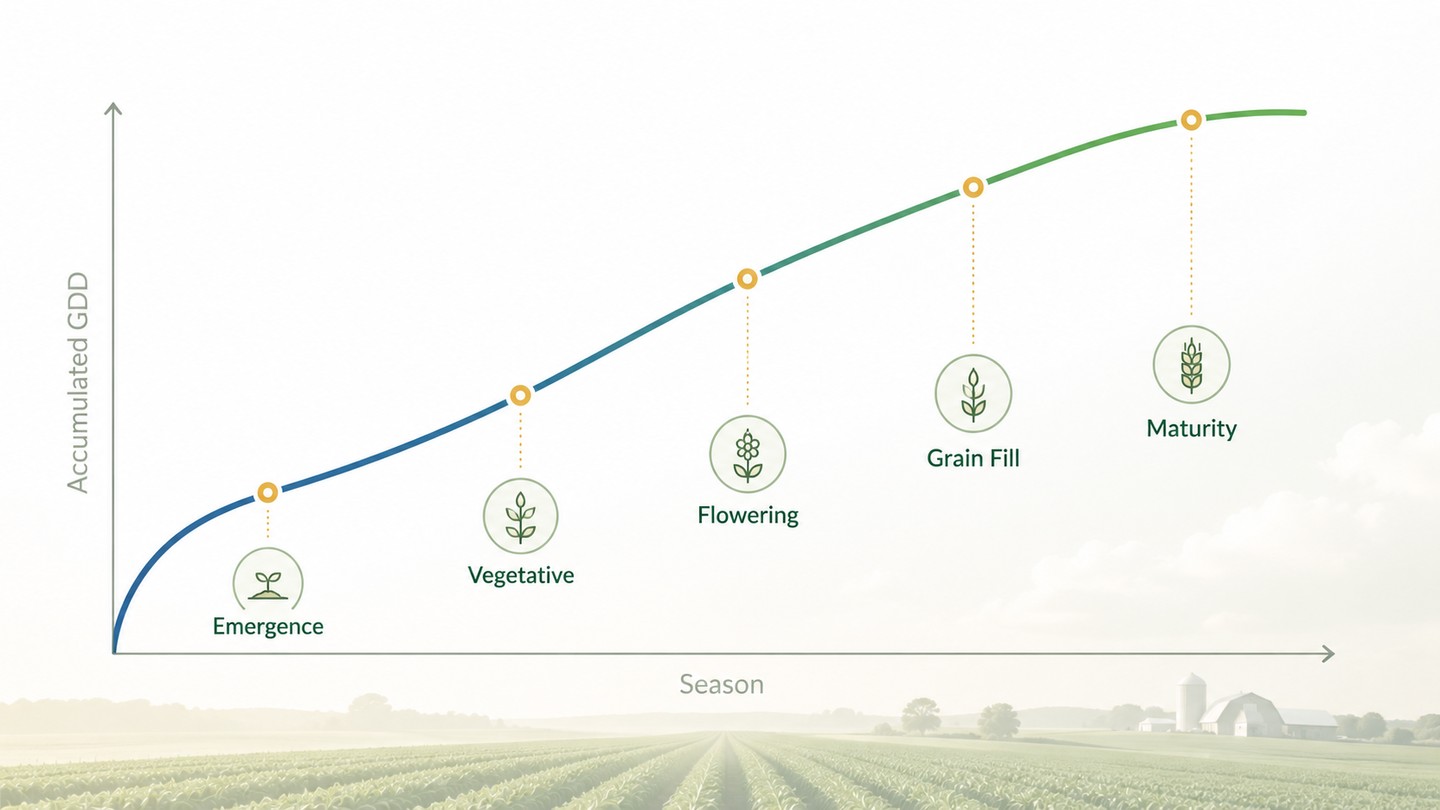
Crop stages are often better predicted using accumulated thermal time than calendar days.
For example, a crop may need a certain amount of accumulated GDD to move from emergence to vegetative growth, from vegetative growth to flowering, or from flowering to maturity. The exact values vary by crop, variety, region, and management system.
GDD can support crop-stage prediction for:
- Emergence
- Leaf development
- Tillering
- Stem elongation
- Flowering
- Pollination
- Fruit development
- Grain fill
- Physiological maturity
- Harvest timing
This is useful because crop-stage prediction makes agronomic decisions more precise.
A fungicide application, for example, may be effective only within a specific crop-stage window. A nitrogen application may have the highest return before or during a defined development phase. Irrigation stress may be most damaging during flowering or grain fill. GDD helps identify when these windows are approaching.
GDD vs Calendar Days
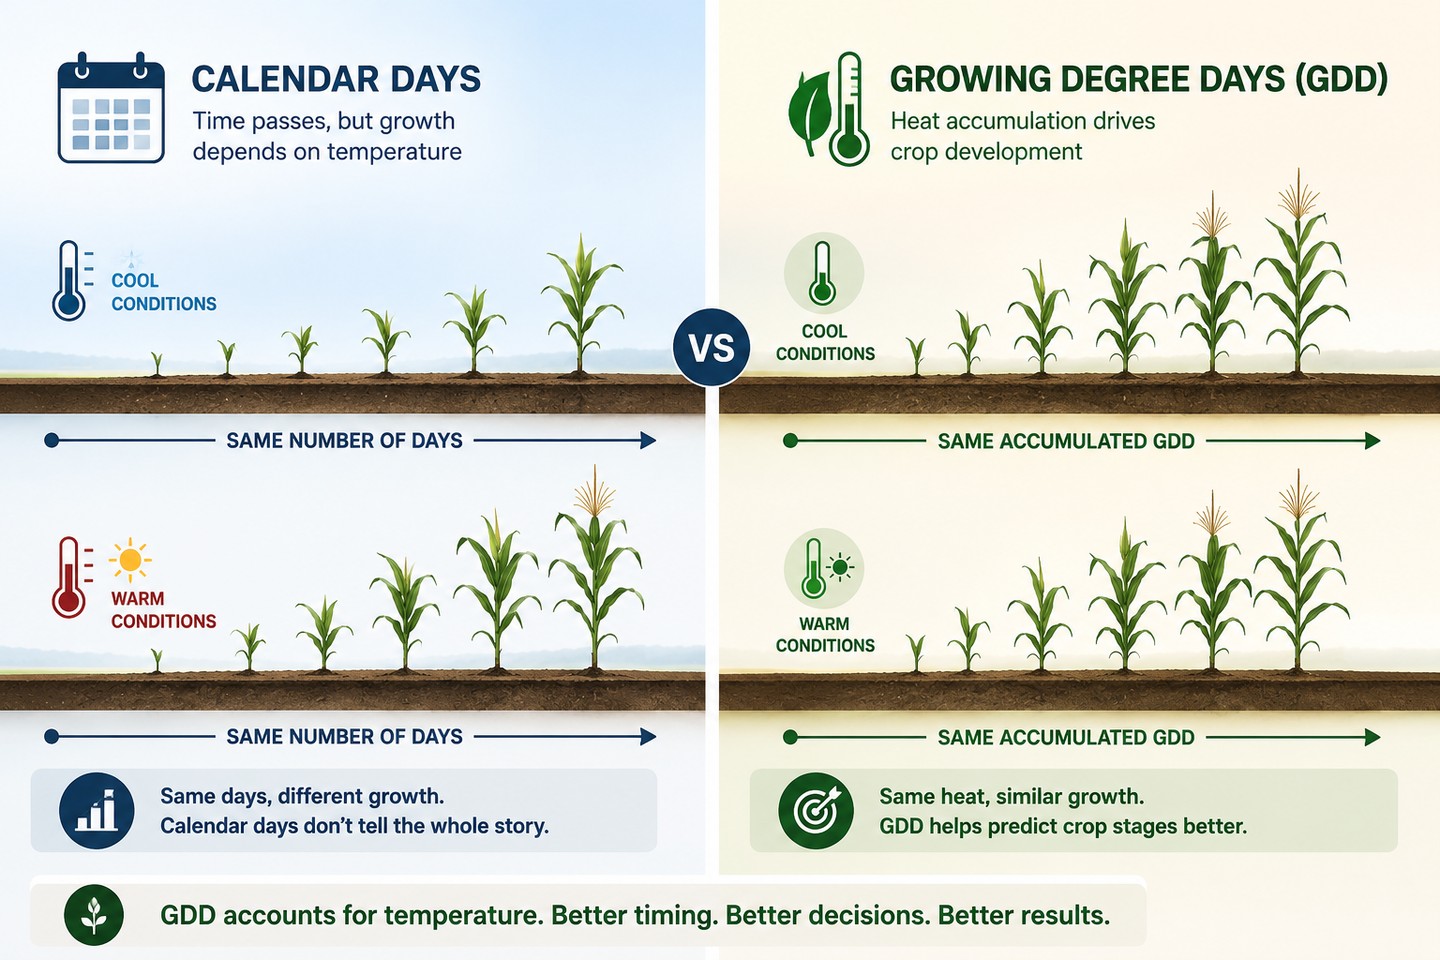
Calendar days are simple, but they do not explain crop development very well when temperature conditions change.
A crop that has been in the field for 40 days during a warm period may be much more advanced than a crop that has been in the field for 40 days during a cool period.
GDD improves this by adjusting for heat accumulation.
Calendar days answer: How much time has passed?
GDD answers: How much useful heat has the crop received?
Crop-stage models answer: What stage is the crop likely to be in now?
For agronomic decision-making, the third question is usually the most useful.
Practical Example of GDD Calculation
Assume a crop uses a base temperature of 10°C.
| Day | Max Temp | Min Temp | Average Temp | Daily GDD |
|---|---|---|---|---|
| Day 1 | 24°C | 12°C | 18°C | 8 |
| Day 2 | 26°C | 14°C | 20°C | 10 |
| Day 3 | 18°C | 8°C | 13°C | 3 |
| Day 4 | 15°C | 5°C | 10°C | 0 |
| Day 5 | 28°C | 16°C | 22°C | 12 |
After five days:
$$ \mathrm{Accumulated\ GDD} = 8 + 10 + 3 + 0 + 12 = 33 $$
This accumulated value can be compared with crop-stage thresholds to estimate development progress.
How GDD Supports Agronomic Decisions
1. Crop-Stage Prediction
The most direct use of GDD is crop-stage prediction. By tracking accumulated heat from planting, emergence, budbreak, or another start point, growers can estimate when the crop is likely to reach key stages.
This is valuable for planning field visits, labor, machinery, product applications, and harvest logistics.
2. Scouting Timing
Scouting is most effective when it is timed to the right biological window. GDD can help indicate when a crop, pest, or disease is likely to reach a stage that requires attention.
This helps agronomists move from reactive scouting to proactive scouting.
3. Pest and Disease Risk Windows
Many pests and diseases are influenced by temperature. Degree-day models are often used to estimate insect development and predict when specific pest stages may appear.
GDD should not be used alone for disease or pest decisions, but it can be a powerful timing layer when combined with humidity, leaf wetness, rainfall, crop stage, and field history.
4. Irrigation Planning
GDD can help estimate crop development stage, which affects rooting depth, canopy cover, crop water demand, and sensitivity to water stress.
For example, water stress during flowering may have a different impact than water stress during early vegetative growth. GDD helps determine where the crop is in that development path.
When combined with soil water balance, evapotranspiration, rainfall, and forecast data, GDD can support more precise irrigation scheduling.
5. Nutrient Timing
Nutrient demand changes with crop stage. GDD can help estimate when nutrient uptake is accelerating and whether an application window is approaching.
This is especially relevant for nitrogen management, fertigation, and variable-rate input planning.
6. Harvest Planning
GDD can support harvest readiness prediction by estimating crop progress toward maturity. This is valuable for logistics, storage planning, contractor scheduling, and prioritizing fields.
Why GDD Alone Is Not Enough
GDD is powerful, but it is not a complete crop model.
It estimates temperature-driven development, but it does not directly explain every field condition. Crop development and performance are also affected by:
- Soil fertility
- Water availability
- Soil compaction
- Salinity
- Drainage
- Plant population
- Pest pressure
- Disease pressure
- Variety or hybrid
- Planting date
- Field operations
- Extreme heat or cold events
- Nutrient limitations
Two fields can accumulate the same GDD but perform very differently because their soils, water status, and management history are different.
This is why GDD should be interpreted together with soil data, satellite data, water balance, weather forecasts, and field observations.
Common Mistakes When Using GDD
Mistake 1: Using the Wrong Base Temperature
A base temperature must match the crop and model. Using the wrong base temperature can distort the accumulated GDD and lead to inaccurate crop-stage prediction.
Mistake 2: Starting Accumulation From the Wrong Date
GDD must be accumulated from a meaningful biological start point, such as planting, emergence, budbreak, transplanting, or a defined crop-stage event.
Mistake 3: Ignoring Upper Temperature Limits
In hot climates, very high temperatures may not continue to accelerate crop development. If the model requires an upper cap, it should be applied consistently.
Mistake 4: Treating GDD as a Yield Prediction by Itself
GDD helps estimate development timing. It does not guarantee yield. Yield depends on many interacting factors, including water, nutrients, genetics, soil, stress events, and management.
Mistake 5: Ignoring Field Variability
A regional GDD value may not represent the exact conditions in a specific field. Elevation, local weather, irrigation, canopy status, and soil moisture can all influence field-level development.
Mistake 6: Using GDD Without Agronomic Interpretation
A GDD chart is useful, but the real value comes from translating it into decisions: inspect, irrigate, apply, delay, prioritize, or prepare.
How Terra Oracle AI Uses GDD
Terra Oracle AI uses GDD as part of its agronomic-indices layer to support crop planning, growth-stage assessment, and operational timing.
The platform connects GDD with:
- Weather history and forecast
- Temperature dynamics
- Rainfall and evapotranspiration
- Water balance
- Satellite imagery and NDVI trends
- Soil variability
- Terrain
- Field operations
- Crop-stage interpretation
- AI agronomic reasoning
This allows GDD to become more than a chart. It becomes part of an explainable decision system.
For example, if a field is approaching a sensitive crop stage, the AI Advisor can help interpret whether the next action should be irrigation, scouting, fertilizer timing, crop protection planning, or a field inspection.
The important difference is the explanation. A user should not only see that the field accumulated a certain number of GDD. The user should understand what that means agronomically.
Learn more: Terra Oracle AI Advisor
Example: From GDD to an Explainable Recommendation
A field has accumulated enough GDD to approach flowering. The weather forecast shows high temperatures and dry conditions. The water balance layer shows that soil moisture is declining. NDVI trends show that part of the field is weaker than the rest.
A basic GDD tool may show only that the crop is near flowering.
An explainable agronomic advisor can go further:
- The crop is approaching a sensitive stage.
- Forecasted heat may increase stress risk.
- Water balance suggests irrigation should be reviewed.
- The weaker NDVI zone may need inspection.
- Soil variability may explain why part of the field is drying faster.
- The next best action may be irrigation, scouting, or targeted field verification.
This is the difference between data display and decision intelligence.
GDD and Satellite Monitoring
Satellite imagery shows how the crop is developing visually across space. GDD shows how much thermal time has accumulated over time.
Together, they are stronger than either layer alone.
For example:
- If GDD indicates that the crop should be advanced, but NDVI is weak, there may be a limiting factor.
- If NDVI increases in line with GDD accumulation, the crop may be developing normally.
- If one zone lags behind another despite similar GDD, the cause may be soil, water, nutrient, drainage, or establishment variability.
- If crop-stage timing differs across regions, GDD helps normalize satellite interpretation across different seasons.
This makes GDD useful not only for crop monitoring, but also for explaining satellite patterns.
GDD and Water Balance
GDD and soil water balance are closely connected.
GDD helps estimate the crop’s development stage. Crop stage affects rooting depth, canopy size, water demand, and sensitivity to water stress. Soil water balance estimates whether the root zone has enough available water.
Together, they support better irrigation decisions.
For example:
- Early crop stage: lower water demand, shallow roots, high sensitivity to establishment issues.
- Rapid vegetative growth: increasing transpiration and nutrient uptake.
- Flowering: often a sensitive stage where water stress may be more damaging.
- Grain fill or fruit development: water availability may affect yield and quality.
- Maturity: irrigation may be reduced or stopped depending on crop and target.
GDD helps identify the stage. Water balance helps assess whether the crop has enough water for that stage.
GDD and Crop Protection Timing
Many crop protection decisions are time-sensitive.
GDD can help estimate when a crop reaches a target stage for product application or when a pest may reach a vulnerable stage. However, crop protection decisions should also consider:
- Crop growth stage
- Product label
- Weather conditions
- Rainfastness
- Wind and sprayability
- Pest or disease pressure
- Resistance management
- Field scouting
- Local regulations
GDD helps with timing, but it should not replace agronomic judgment or label requirements.
What Makes a Good GDD Tool?
A good GDD tool should be:
Crop-Specific
It should use the correct base temperature and crop-stage logic.
Field-Specific
It should use weather data that is relevant to the actual field, not only a distant regional station.
Dynamic
It should update daily as new weather data arrives.
Forecast-Aware
It should estimate upcoming development, not only accumulated past GDD.
Connected
It should connect GDD with water balance, NDVI, soil data, and operations.
Explainable
It should show what the GDD status means and what action may be relevant.
The Future of GDD in AI Agronomy
Growing degree days are not new. What is changing is how they are used.
In traditional agronomy, GDD is often shown as a chart or cumulative number. In AI agronomy, GDD becomes one signal in a connected reasoning system.
The future is not simply calculating heat units. It is understanding what accumulated heat means for the field today.
That means combining GDD with:
- Soil intelligence
- Satellite monitoring
- Weather forecasts
- Water balance
- Operations data
- Crop-stage models
- Risk alerts
- Economic decision-making
- Explainable AI recommendations
This is where GDD becomes part of practical decision intelligence.
FAQ
What are growing degree days?
Growing degree days are a measure of accumulated heat used to estimate crop development. They are calculated by comparing daily temperatures with a crop-specific base temperature.
How do you calculate GDD?
The simple GDD calculation is:
$$ \mathrm{GDD} = \frac{T_{\max} + T_{\min}}{2} - T_{\mathrm{base}} $$
If the result is below zero, the daily GDD is usually recorded as zero.
What are GDD crop stages?
GDD crop stages are crop development stages estimated using accumulated growing degree days. They help predict events such as emergence, flowering, maturity, and harvest readiness.
Why is GDD better than calendar days?
GDD accounts for temperature differences between seasons. A crop may develop faster in warm weather and slower in cool weather, even if the same number of calendar days has passed.
What is “base temperature” in GDD?
Base temperature is the lower temperature threshold below which crop development is assumed to be minimal or stopped. It varies by crop and model.
Does GDD predict yield?
GDD helps predict crop development timing, but it does not predict yield by itself. Yield also depends on water, nutrients, soil conditions, pests, disease, genetics, and management.
Can GDD help with irrigation scheduling?
Yes. GDD helps estimate crop stage, which affects crop water demand and sensitivity to water stress. When combined with soil water balance and weather forecasts, it can support better irrigation timing.
How does Terra Oracle AI use GDD?
Terra Oracle AI uses GDD as part of its agronomic-indices layer. The platform connects GDD with weather, water balance, NDVI, soil data, field operations, and AI Advisor recommendations to support explainable crop-stage and timing decisions.
Conclusion
Growing degree days help farmers move from calendar timing to thermal-time timing. Used with soil, water balance, NDVI, and field context, GDD becomes a practical layer for crop-stage prediction and operational decisions.
Learn more:
- AI Advisor
- Soil Water Balance for Irrigation Decisions
- The Sprayability Index, Explained
- Precision Agriculture Software & Platform
References
- Michigan State University Extension. Understanding growing degree days .
- Penn State Extension. Understanding growing degree days .
- University of Wisconsin Horticulture Extension. Calculating degree days .
- University of Florida IFAS. Degree-Days: Growing, Heating, and Cooling (AE428).
- Oregon State University Extension. Vegetable degree-day models: an introduction for farmers and gardeners (EM 9305).
- Miller, P., Lanier, W., & Brandt, S. Montana State University Extension. Using Growing Degree Days to Predict Plant Stages (MT200103AG).
- European Environment Agency / Climate-ADAPT. Growing degree days .
- Keramitsoglou, I., et al. (2023). SENSE-GDD: A satellite-derived temperature monitoring service to provide growing degree days . Agriculture, 13(5), 1108.
- Fotouo Makouate, H., & Zude-Sasse, M. (2025). Advances in growing degree days models for flowering to harvest: optimizing crop management with methods of precision horticulture—a review . Horticulturae, 11(12), 1415.